Thirty-nine releases in twelve days. Each one checked live.
An EU-wide data product. One owner, two AI build lanes, small verified steps.
Scoped releases, 8 to 17 Oct. About 1,290 file uploads.
Mobile Lighthouse performance on the five key pages.
Script errors across 132 page loads.
Mismatches across about 2,500 values.
Nobody marks their own homework.
The owner decides. One lane designs and checks. The other builds and ships.
- Sets the goal, approves each item
- Calls the trade-offs: fewer words, more visuals
- Owns outreach
- Writes the brief and the prototype
- Checks each release live, in a browser
- Runs the study, fact-checks the research
- Builds, tests and deploys a scoped set of files
- Hash-checks every upload against the server
- Logs the change and closes the item
Seven tests passed. Every flag was broken.
A live look caught it. The fix was out in about 25 minutes, and every explorer release now proves its images rendered.
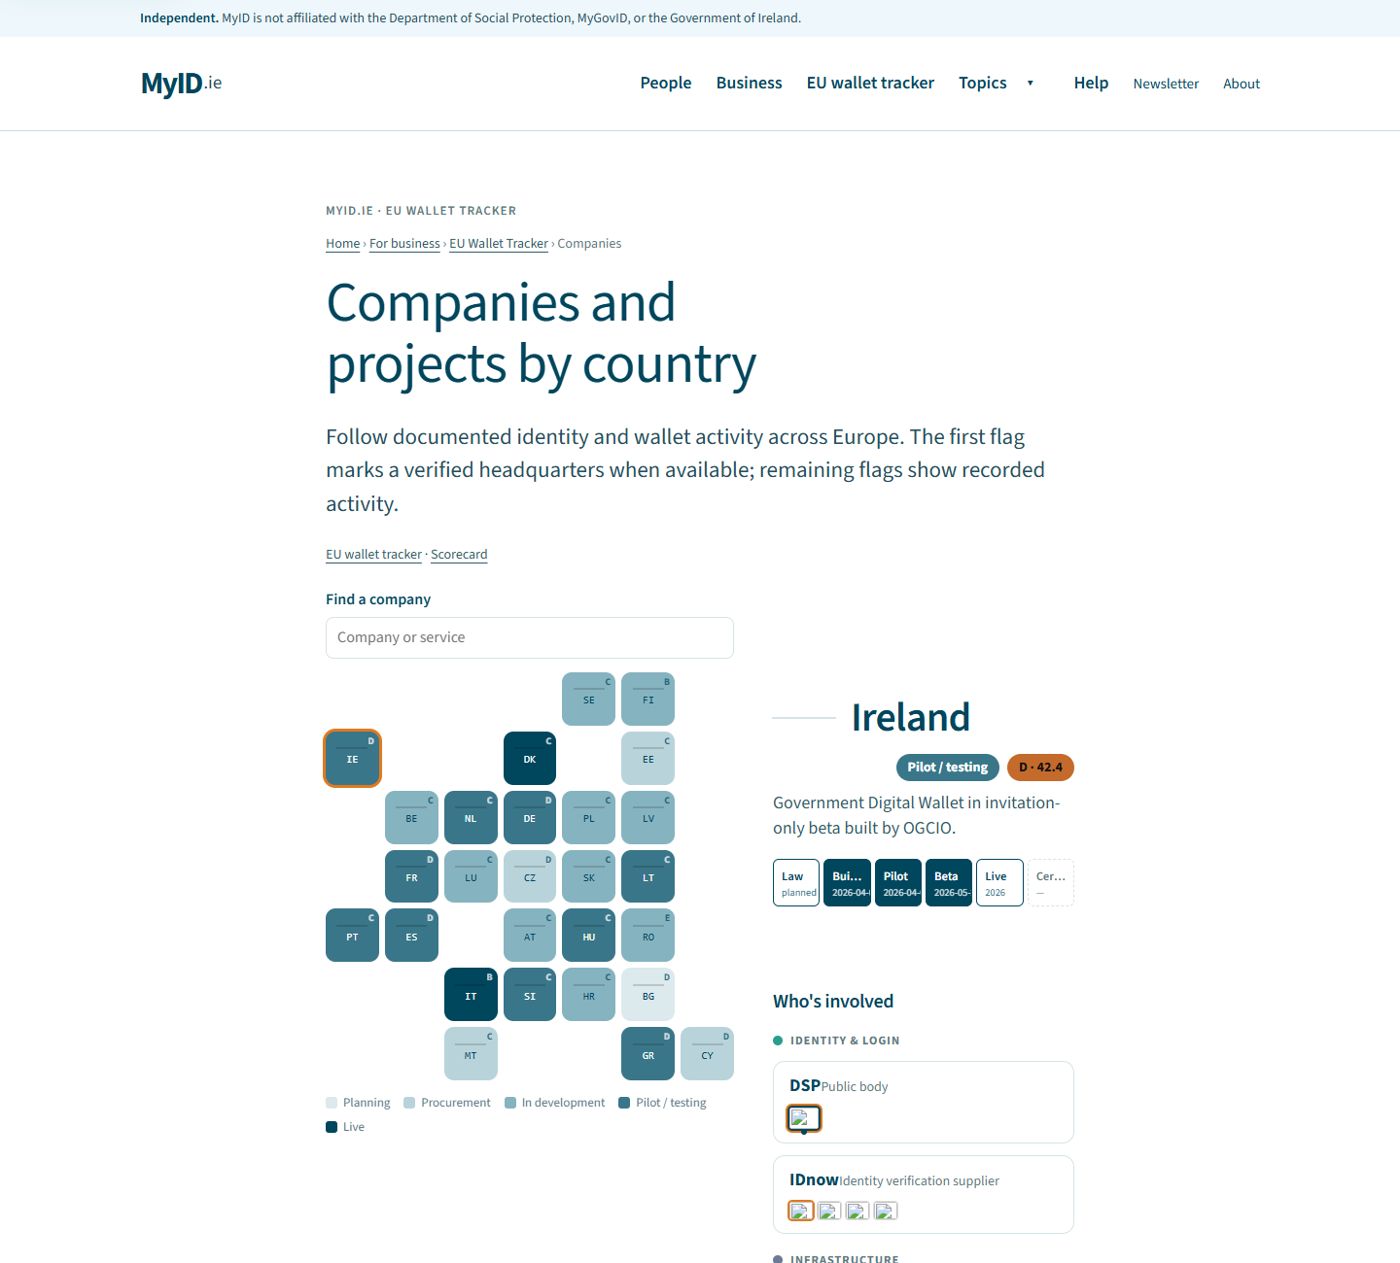
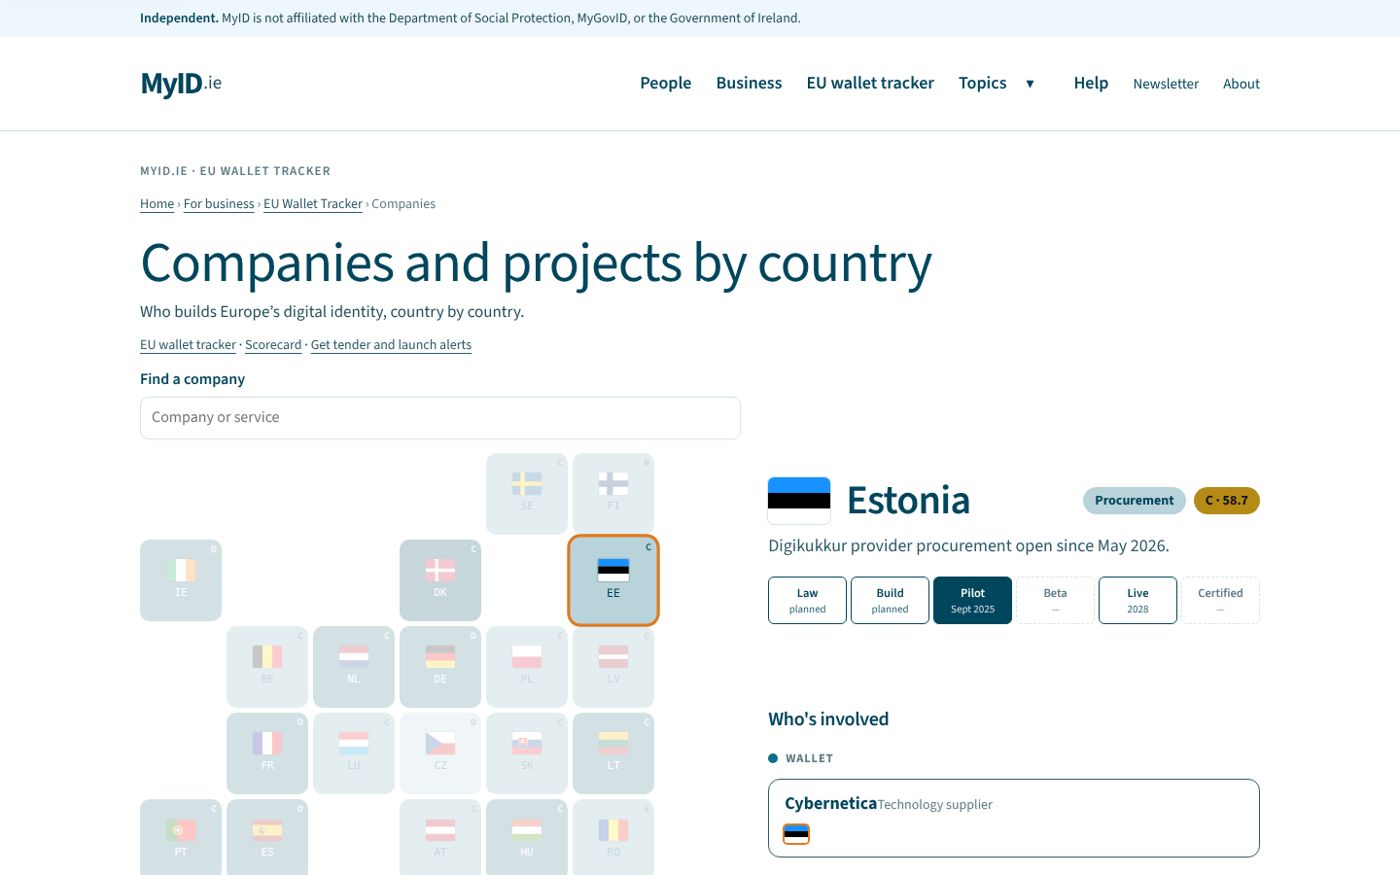
What happened
The rebuilt company map passed 7 of 7 acceptance tests and an accessibility scan with no serious issues. In a browser, every flag was a broken-image icon. The build lane's own screenshot showed it too.
The review lane found the cause, one SVG attribute browsers require, and briefed the fix.
Two releases passed. Together they disagreed.
Belgium was a C in one place and a D in another. Now the build fails if any grade differs from the one data file.
What happened
Two releases ran side by side on different files. One rescored the scorecard, so every point needed an outside source and three countries dropped a grade. The other rebuilt the company map with the old grades. Each passed its own checks.
The live check caught it within about 20 minutes. Fourteen countries were out of step.
Most of what we found never made the page.
A flag is a claim. It needs a first-party source naming the company and the country.
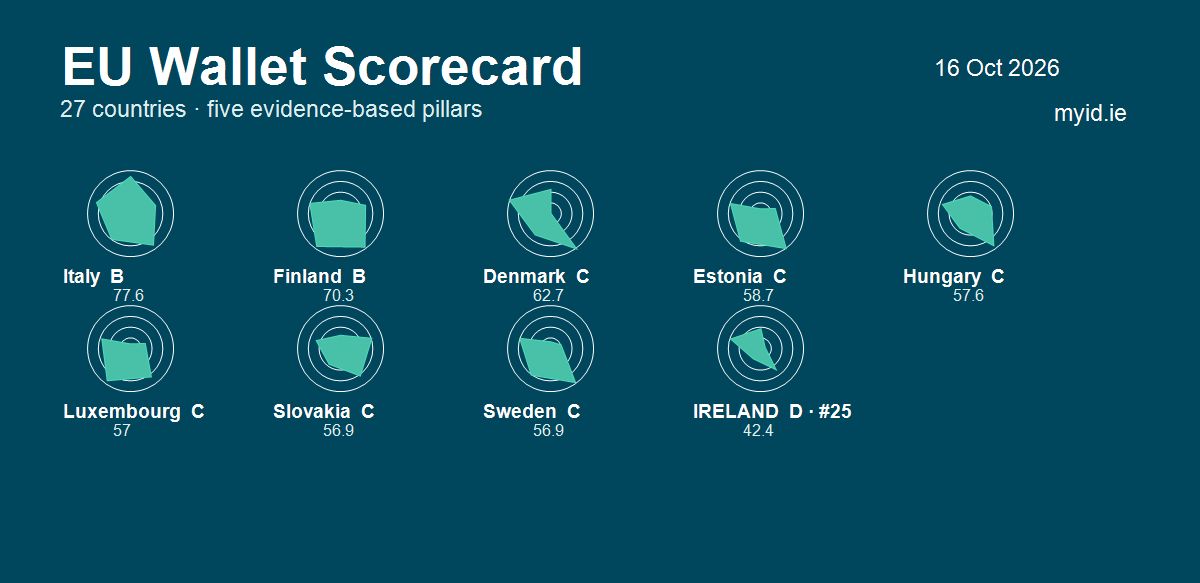
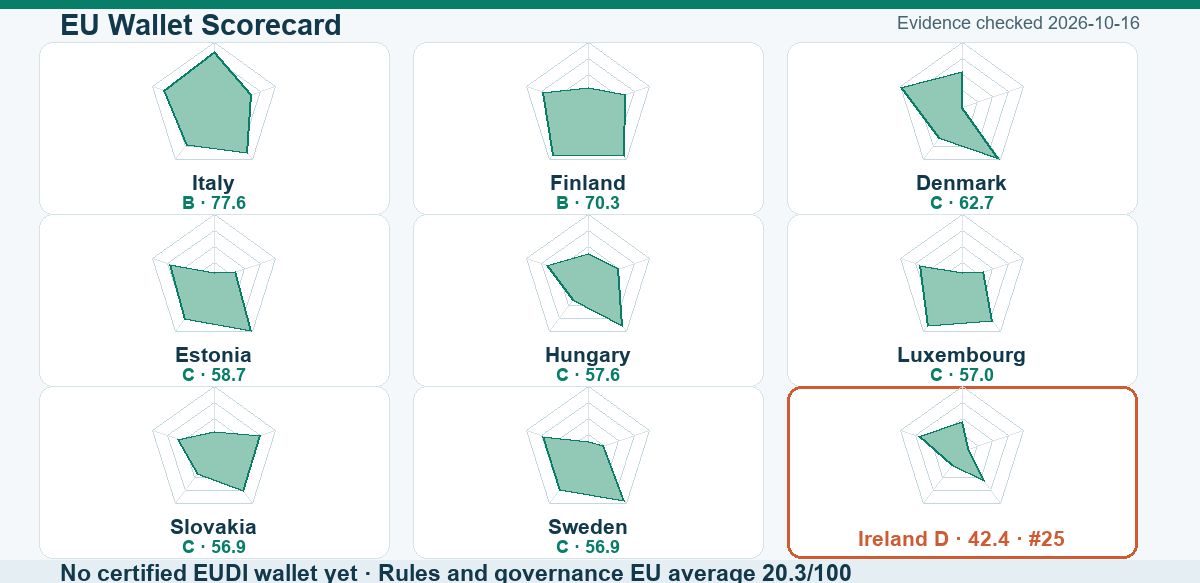
From a wall of text to something you can point at.
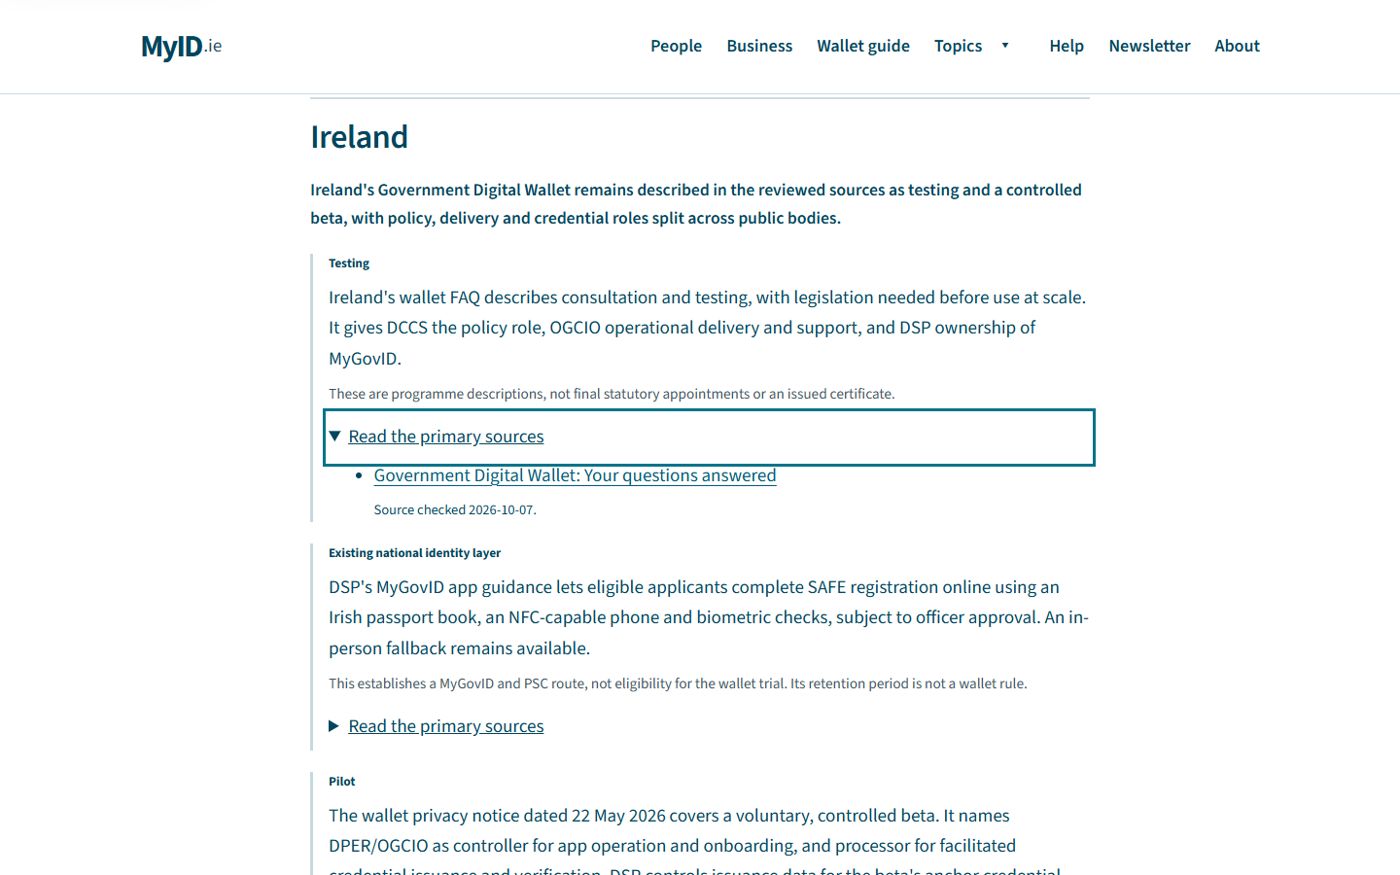
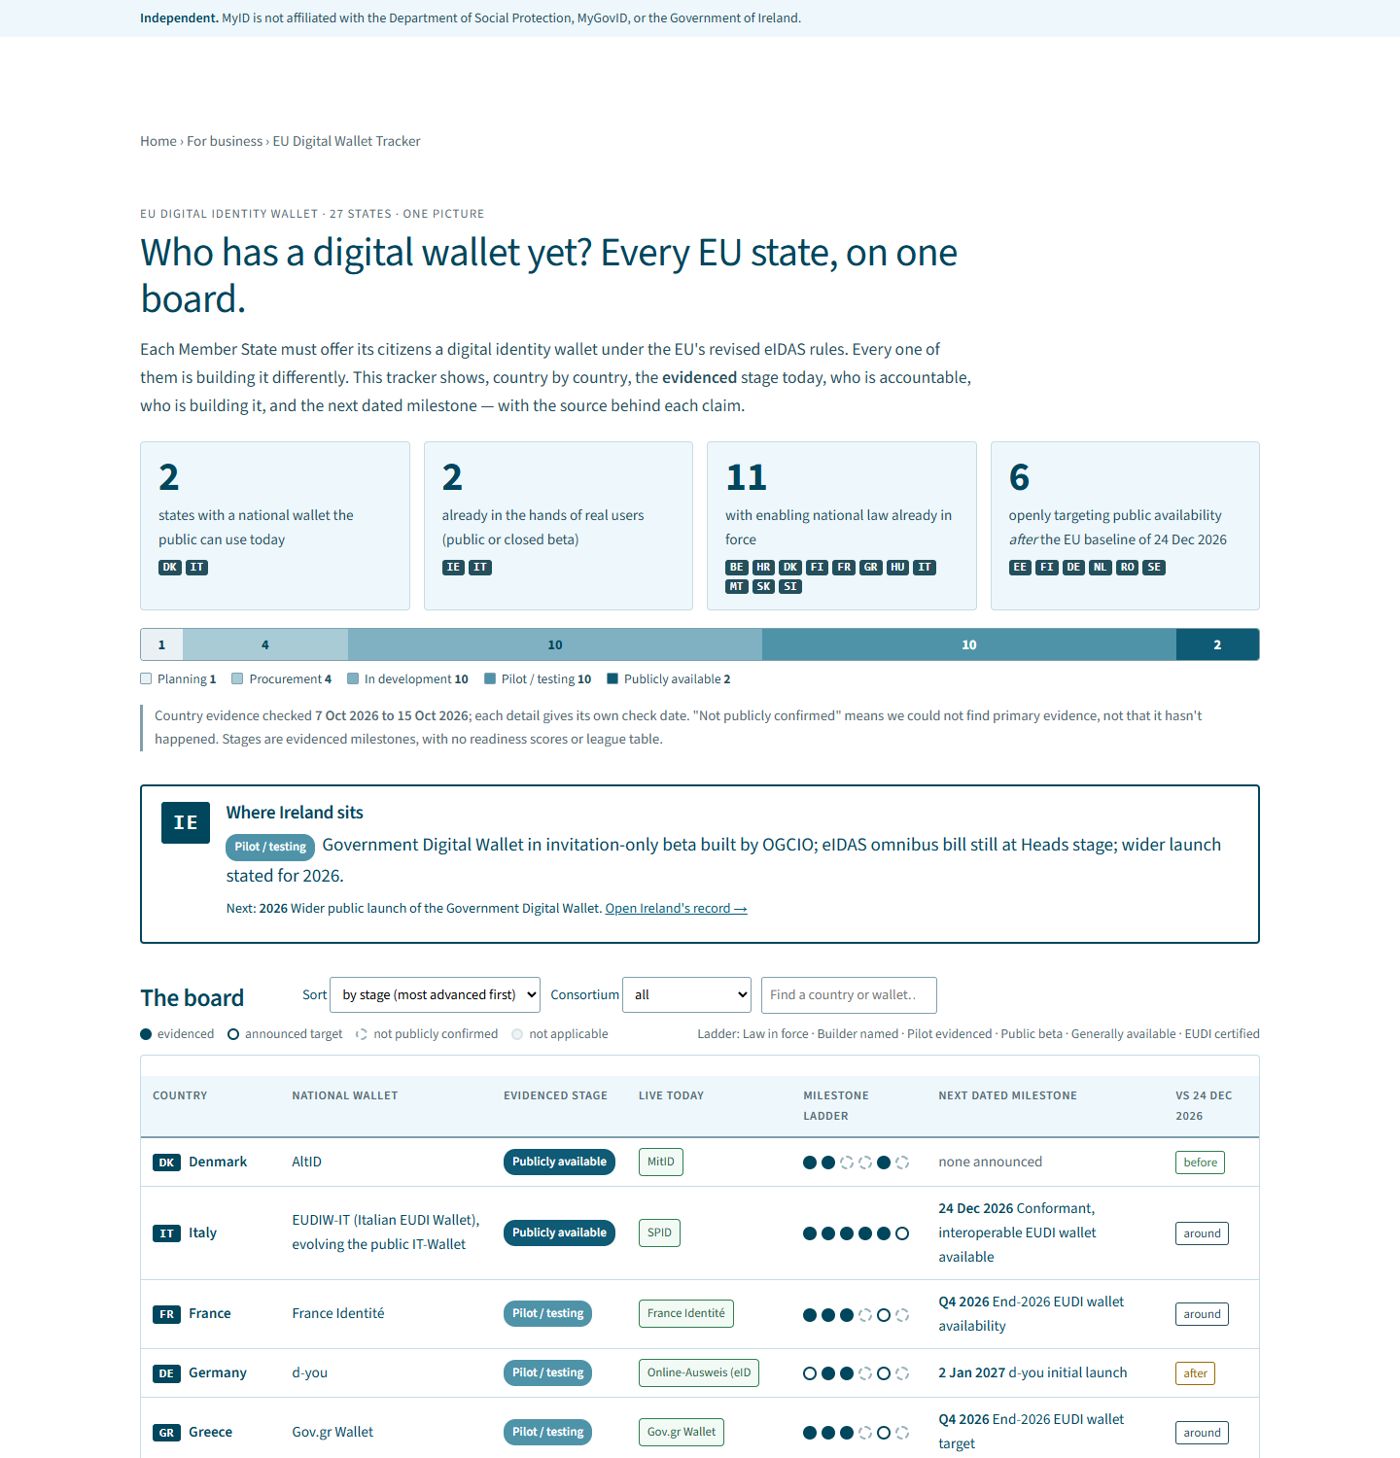
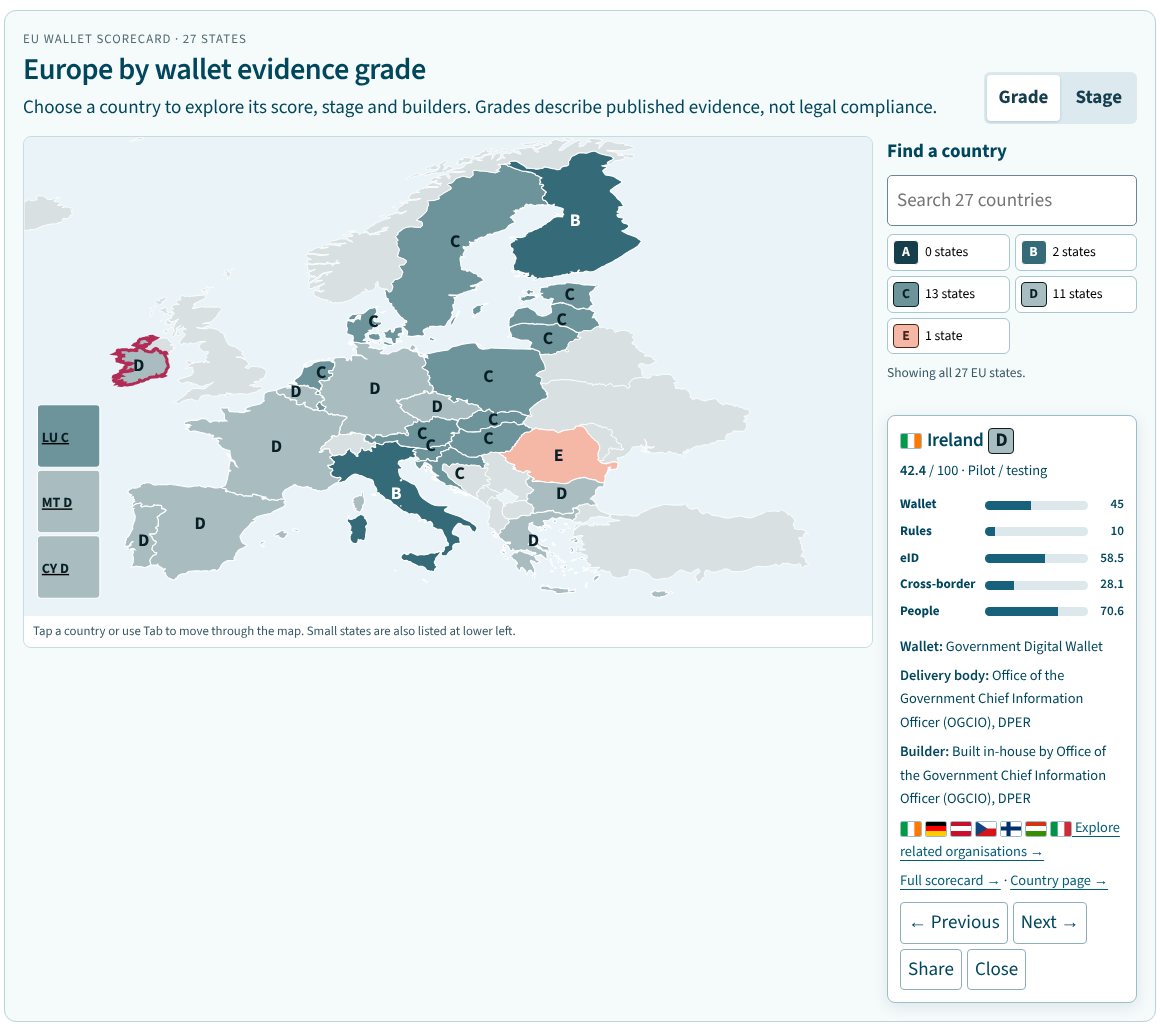
Share image, v1 and v2
Next to the trackers people already use.
The only one of the three that grades each country and sources every scored point.
| Feature | myid.ie | iGrant.io tracker | eID Easy snapshot |
|---|---|---|---|
| Coverage | EU 27, plus Ukraine | 37 jurisdictions | EU, candidates, EEA, CH, UK |
| Map | Grade map with letters, plus a company map | Real map, hover and pin | Static image |
| Who builds what | Named builders, home and works-in flags | Provider field | Authority only |
| Grading | A–E, five pillars, "Limited" tag | Six status types | Six levels, "not a ranking" |
| Sources | Dated, per scored input | Dated, per country | None per row |
| Open data | JSON and CSV | JSON on GitHub, CC BY 4.0 | None |
| Embed | Not yet | Iframe and badges | No |
Checked 17 Oct 2026. iGrant's map inspired the grade map. Both trackers are credited on the method page.
A studio that runs on what it sells.
Small scoped releases. A brief for each. A second lane that checks the live result. A diary of every change.
One owner, twelve days. The slow parts were the right ones: checking sources, and fixing what a test couldn't see.